| Box Plot Chart with variable width boxes 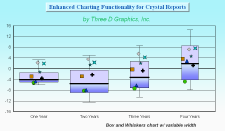
| Smooth Line Curve with Histogram 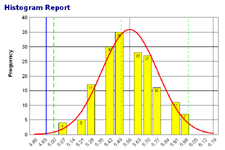
| Pareto Chart 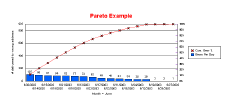
|
| Error Bars and User Defined Lines 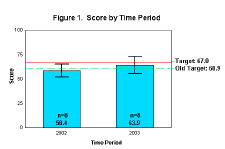
| Scatter Chart with User Defined Lines 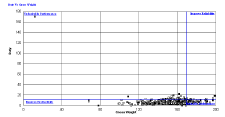
| User Defined Regions 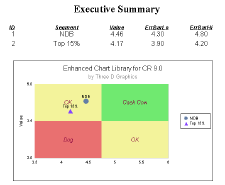
|
| Waterfall Chart 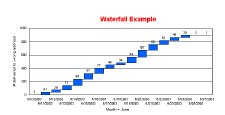
| Waterfall Chart with Total Column 
| Step Line Chart 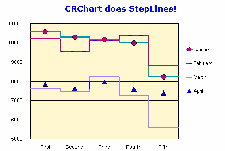
|
| Audiogram Chart 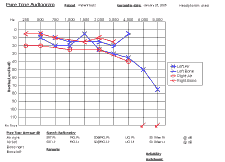
| Gantt Chart 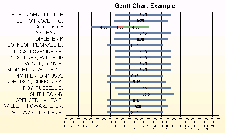
| Smooth Line Curve 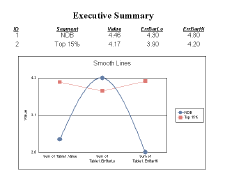
|
| Conditional Styling and Programmable markers 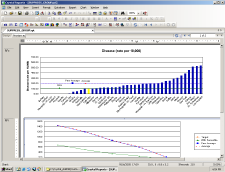
| Advanced Statistical Analysis 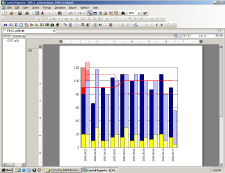
| Conditional User Lines and Programmable Markers 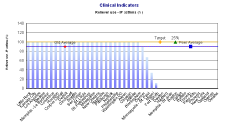
|
| Using the new @COMPARE2 macro to compare 2 series 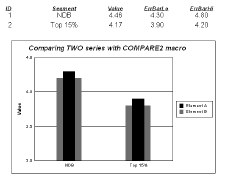
| Custom @USERFILL macros working with runtime data 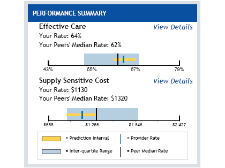
| |